本博文的示例采用 SConstruct 脚本来书写,关于如何采用 SConstruct 写 Seismic Unix 脚本详见另一篇博文 http://nickwhyy.top/su-scons-together/ 。
二维数据
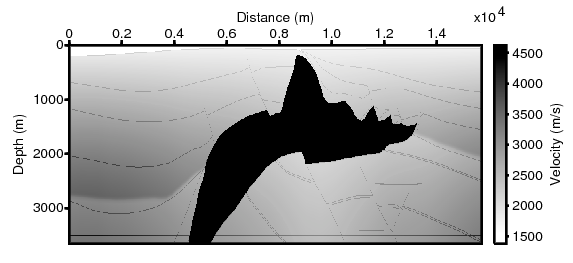
灰度图
 1
 2
 3
 4
 5
 6
 7
 8
 9
10
11
12
13
14
15
16
| from rsf.proj import *
import rsf.suproj as sp
sp.Flow('velocity.eps','velocity.dat',
'''
psimage
n1=300 d1=12.192 d2=12.192
d1num=1000 f1num=0 n1tic=1
d2num=2000 f2num=0 n2tic=1
width=3.33 height=1.6
label2='Distance (m)' label1='Depth (m)' labelsize=8
legend=1 lstyle=vertright units='Velocity (m/s)'
lwidth=0.1 lheight=1.6
''')
End()
|
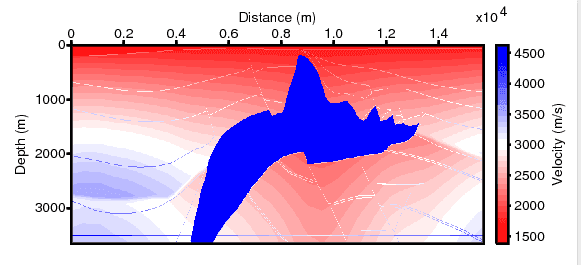
彩色图
 1
 2
 3
 4
 5
 6
 7
 8
 9
10
11
12
13
14
15
16
17
| from rsf.proj import *
import rsf.suproj as sp
sp.Flow('vel-color.eps','velocity.dat',
'''
psimage
n1=300 d1=12.192 d2=12.192
d1num=1000 f1num=0 n1tic=1
d2num=2000 f2num=0 n2tic=1
width=3.33 height=1.6
label2='Distance (m)' label1='Depth (m)' labelsize=8
legend=1 lstyle=vertright units='Velocity (m/s)'
lwidth=0.1 lheight=1.6
threecolor=1 wrgb=1.0,0,0 grgb=1.0,1.0,1.0 brgb=0,0,1.0
''')
End()
|
波形图
1
2
3
4
5
6
7
| sp.Flow('dn.eps','dn.bin',
'''
pswigb
n1=501 d1=0.002 d2=1
wbox=3.33 hbox=4
label2='Trace #' label1='Time (s)' labelsize=8
''')
|

三维数据
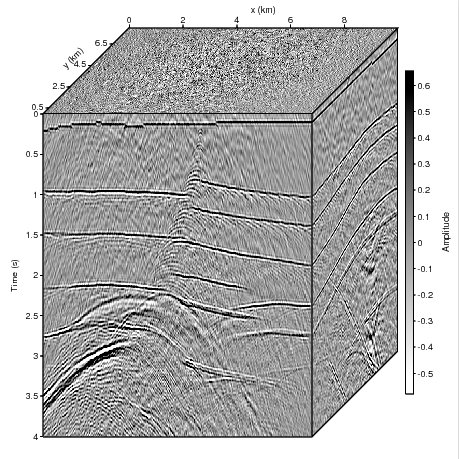
灰度图
 1
 2
 3
 4
 5
 6
 7
 8
 9
10
11
12
13
14
15
16
17
18
19
20
21
22
| sp.Flow('salt3d_dat_txy.eps','salt3d_dat_txy.TRC',
'''
pscube n1=501 n2=250 n3=201
d1=0.008 f1=0
d2=0.04 f2=0
d3=0.04 f3=0
f3num=0.5
d3num=2
n3tic=1
size1=4 size2=3.33 size3=1.5
label1='Time (s)'
label2='x (km)'
label3='y (km)'
labelsize=8
perc=98
bps=24
legend=1
lstyle=vertright
units='Amplitude'
lwidth=0.1
lheight=4.0
''')
|
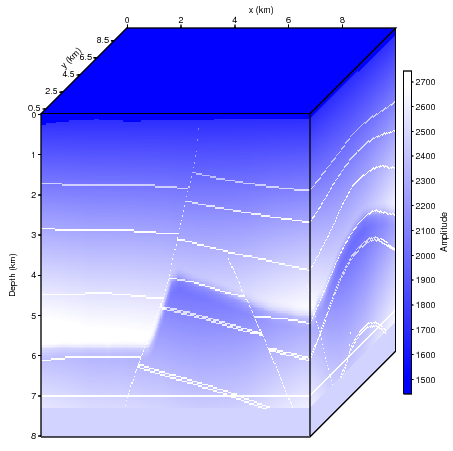
彩色图
 1
 2
 3
 4
 5
 6
 7
 8
 9
10
11
12
13
14
15
16
17
18
19
20
21
22
23
24
| sp.Flow('salt3d_vel_zxy.eps','salt3d_vel_zxy.TRC',
'''
pscube n1=201 n2=250 n3=250
d1=0.04 f1=0
d2=0.04 f2=0
d3=0.04 f3=0
f3num=0.5
d3num=2
n3tic=1
size1=4 size2=3.33 size3=1.5
label1='Depth (km)'
label2='x (km)'
label3='y (km)'
labelsize=8
perc=98
bps=24
legend=1
lstyle=vertright
units='Amplitude'
lwidth=0.1
lheight=4.0
wrgb=0.0,0.0,1.0 grgb=1.0,0.0,0.0 brgb=1.0,1.0,1.0
bps=24
''')
|
参考资料
http://blog.sciencenet.cn/blog-2834901-1084725.html
